
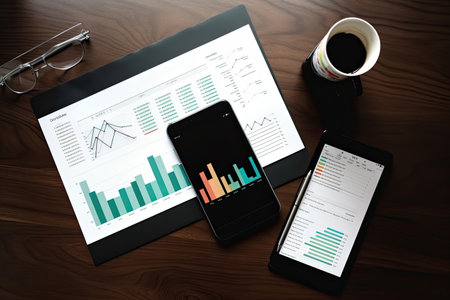
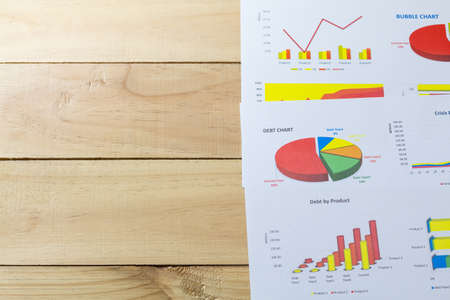
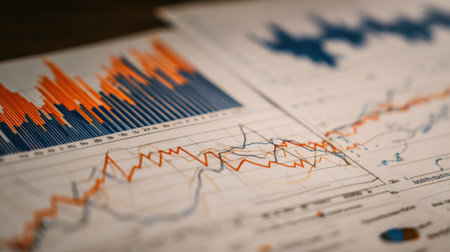
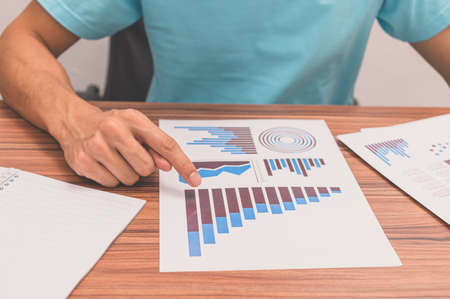
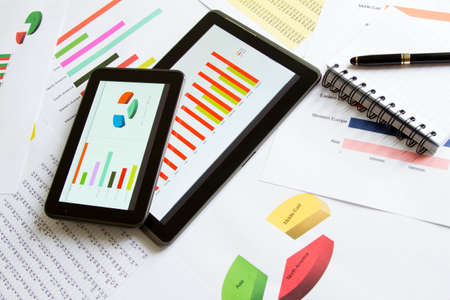
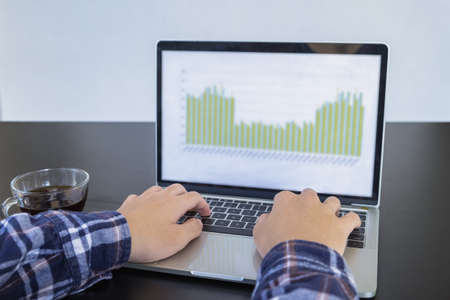
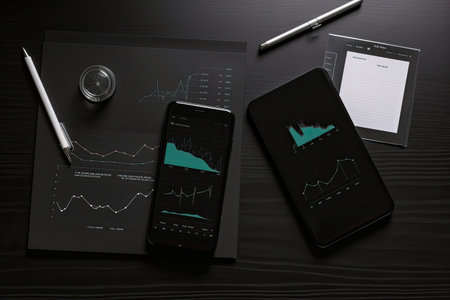
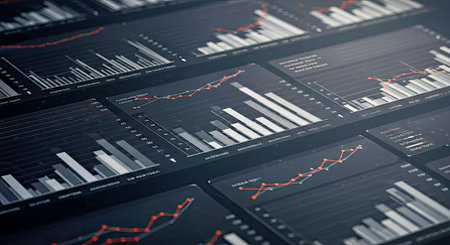
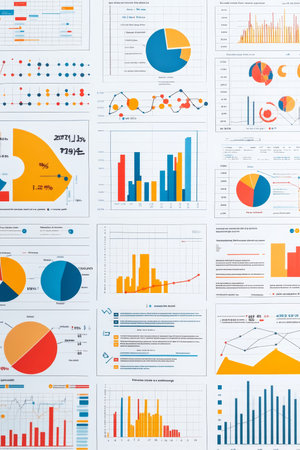
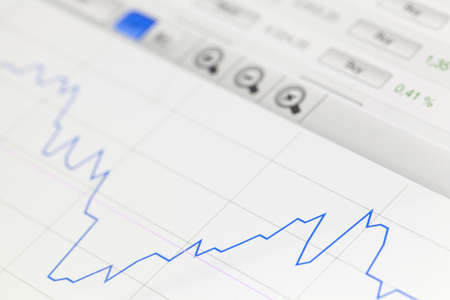
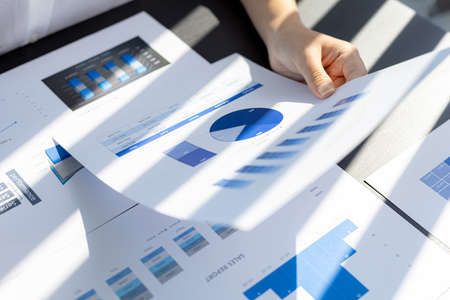
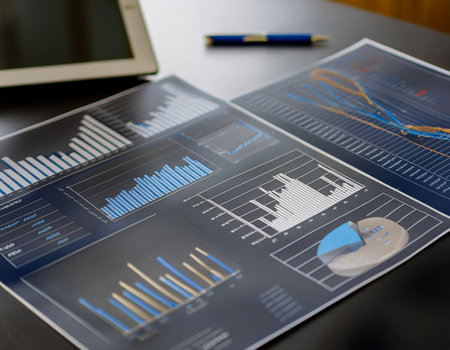
Smartphone and Tablet pc with financial charts and graphs on office desk, business concept
Коллекция по умолчанию
Коллекция по умолчанию
Создать новую

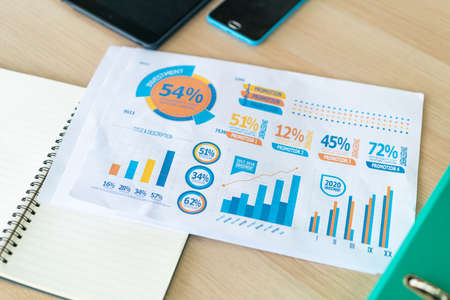
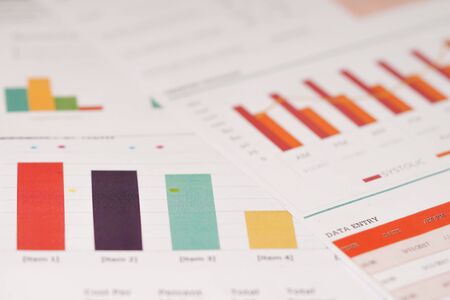
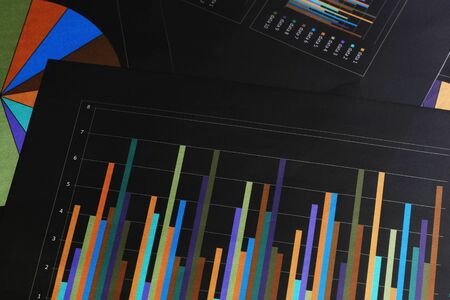
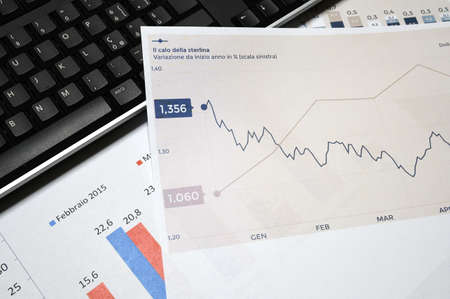
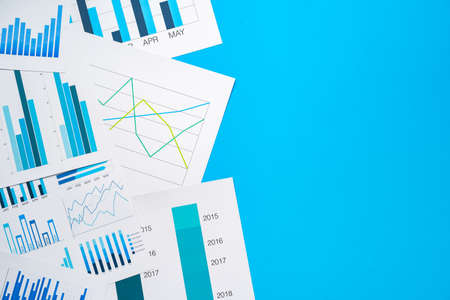
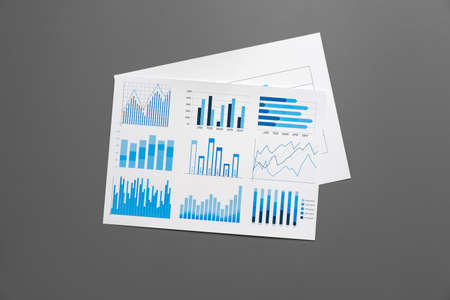
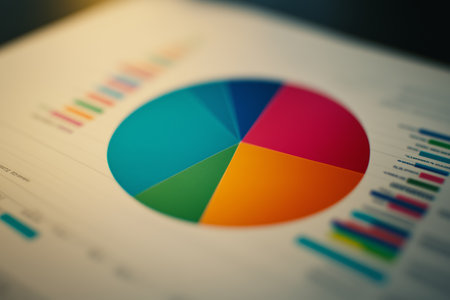
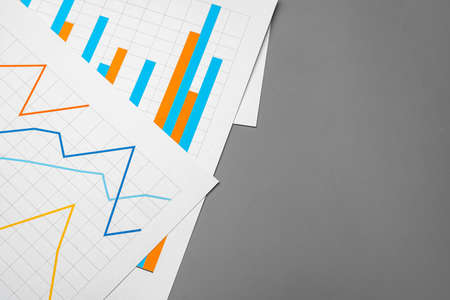
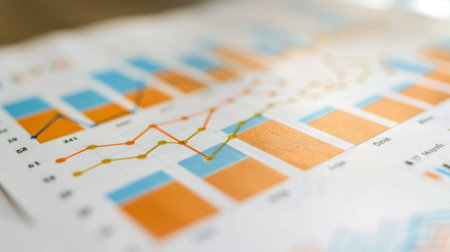
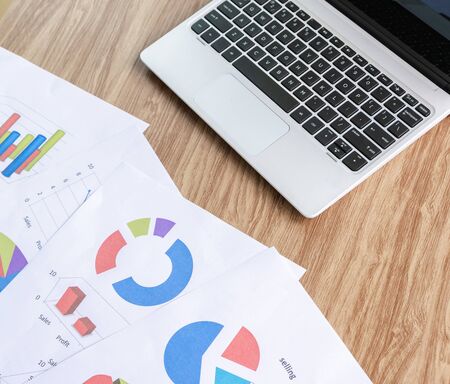
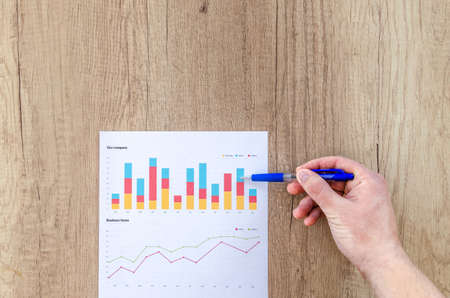
chart or graph paper. Financial, account, statistics and business data concept.
Коллекция по умолчанию
Коллекция по умолчанию
Создать новую

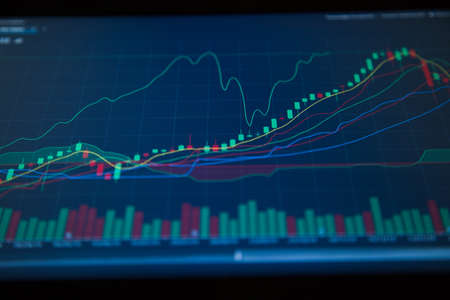
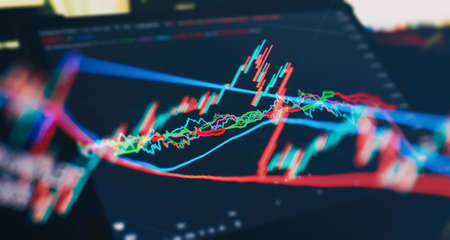
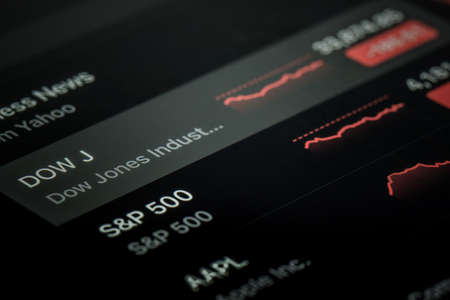
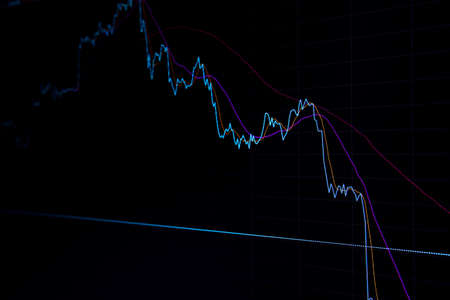
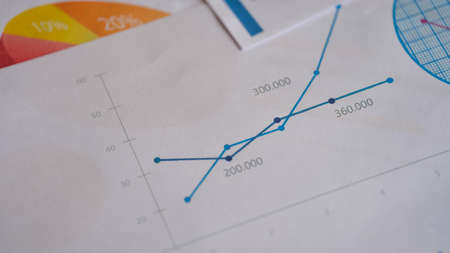
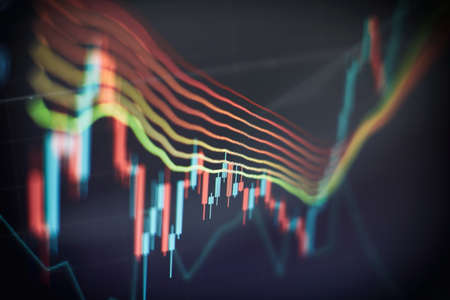
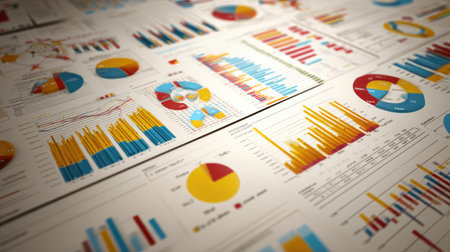
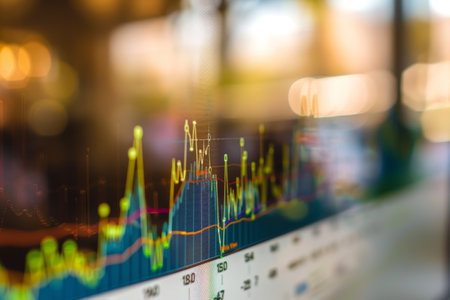
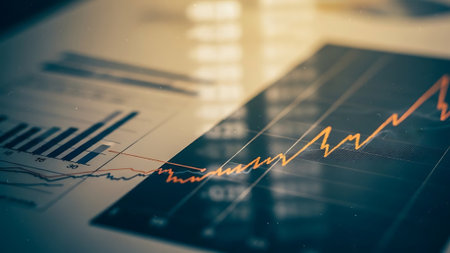
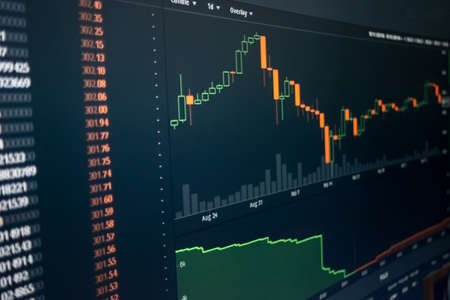
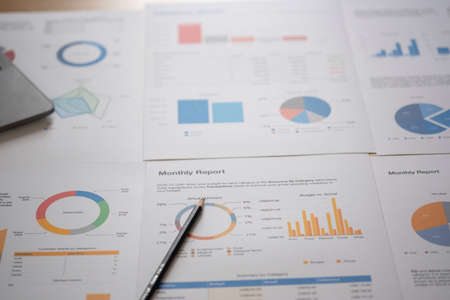
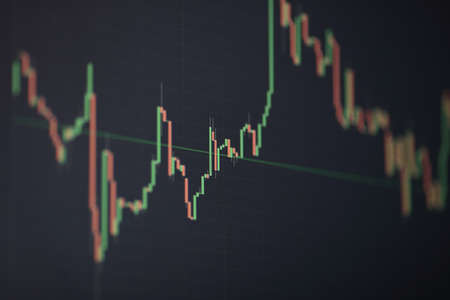
Shallow depth of field (selective focus) with details of a chart showing the stock market crash from March 2020 due to the Covid-19 pandemic on a computer screen (S&P500 index)
Коллекция по умолчанию
Коллекция по умолчанию
Создать новую
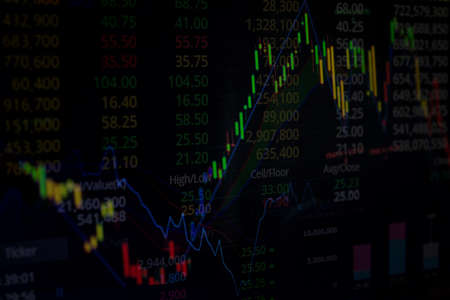
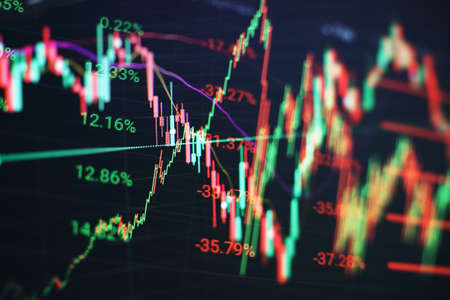
Stock Market Chart on Blue Background. share drop down and stock up
Коллекция по умолчанию
Коллекция по умолчанию
Создать новую
close-up business graph paper on working table
Коллекция по умолчанию
Коллекция по умолчанию
Создать новую
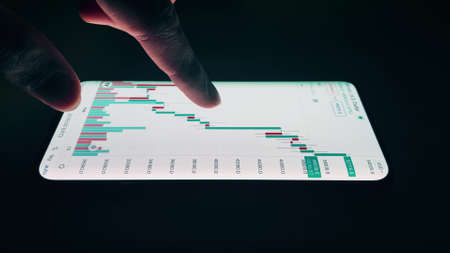
A timeline chart showing events and milestones over time AI generated
Коллекция по умолчанию
Коллекция по умолчанию
Создать новую
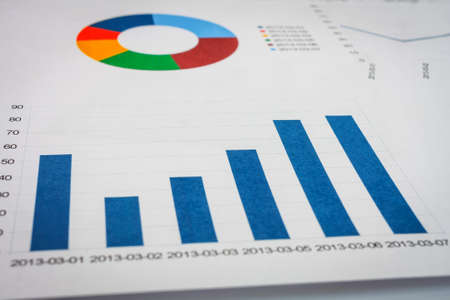
Charts Graphs spreadsheet paper. Financial development, Banking Account, Statistics, Investment Analytic research data economy, Stock exchange Business office company meeting concept.
Коллекция по умолчанию
Коллекция по умолчанию
Создать новую
Data financial instruments chart, downtrend stock market analysis report
Коллекция по умолчанию
Коллекция по умолчанию
Создать новую
Business statistics and Analytics value . Abstract glowing forex chart interface background. Investment, trade, stock, finance and analysis concept.
Коллекция по умолчанию
Коллекция по умолчанию
Создать новую

image is a graph of financial development on a computer monitor.
Коллекция по умолчанию
Коллекция по умолчанию
Создать новую

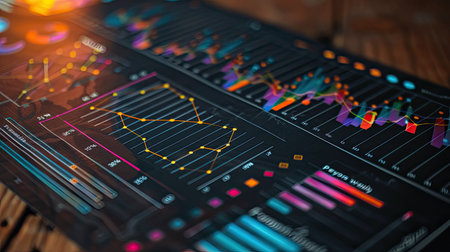
Data visualization showing trends and user interaction metrics over time in digital format
Коллекция по умолчанию
Коллекция по умолчанию
Создать новую
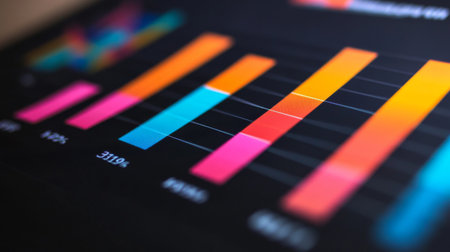
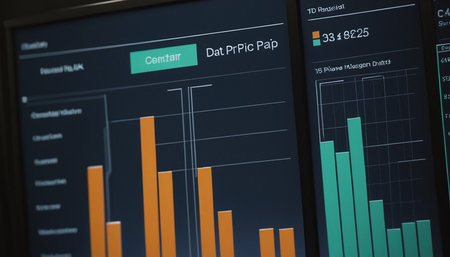
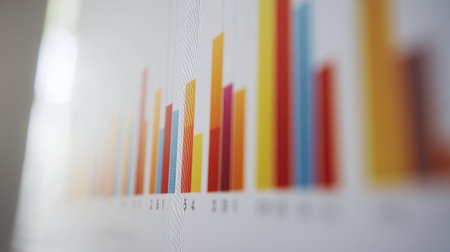
Vibrant bar graph displayed on a digital screen, showcasing data insights and trends for business analysis. Ideal for presentations and reports.
Коллекция по умолчанию
Коллекция по умолчанию
Создать новую
A stock market graph on a black background.
Коллекция по умолчанию
Коллекция по умолчанию
Создать новую
graph chart of stock market investment trading.
Коллекция по умолчанию
Коллекция по умолчанию
Создать новую
Medium shot of a closeup on charts and graphs illustrating loan interest rate fluctuations over time
Коллекция по умолчанию
Коллекция по умолчанию
Создать новую

reports and histograms on paper on the table, analytics and statistics on paper, business analytics
Коллекция по умолчанию
Коллекция по умолчанию
Создать новую
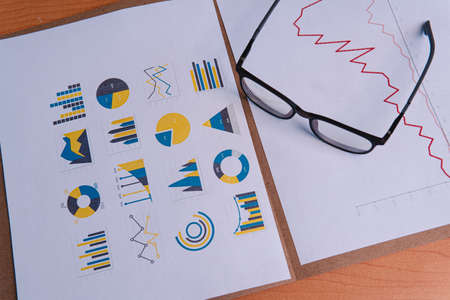
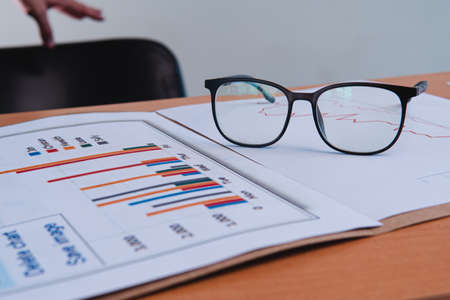
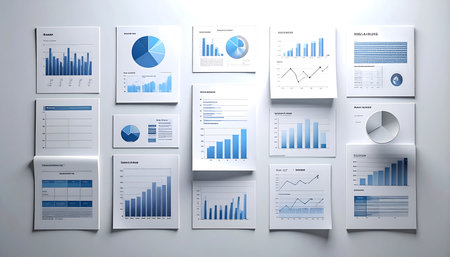
Business themed presentation templates. Background with papers full of graphs and executive glasses. Folder with papers full of graphs and glasses on a table. High quality photo
Коллекция по умолчанию
Коллекция по умолчанию
Создать новую

image of the financial graph on a computer monitor.
Коллекция по умолчанию
Коллекция по умолчанию
Создать новую

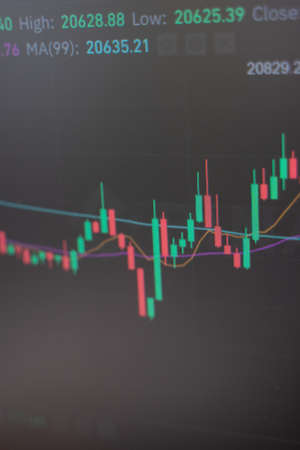
Shallow depth of field (selective focus) with details of a candlestick chart on a computer screen.
Коллекция по умолчанию
Коллекция по умолчанию
Создать новую
Grow Stock market trading graph in graphic concept.financial investment or economic trends business design. Abstract finance background.Low angle shot.
Коллекция по умолчанию
Коллекция по умолчанию
Создать новую
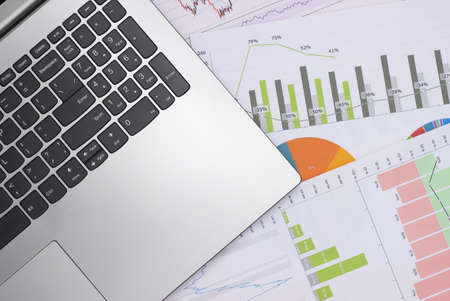
Business performance analysis. Business Graphs with Keyboard, pen.
Коллекция по умолчанию
Коллекция по умолчанию
Создать новую
Close up of business graph analysis document
Коллекция по умолчанию
Коллекция по умолчанию
Создать новую
Charts Graphs paper. Financial development, Banking Account, Statistics, Investment Analytic research data economy, Stock exchange Business office company meeting concept.
Коллекция по умолчанию
Коллекция по умолчанию
Создать новую
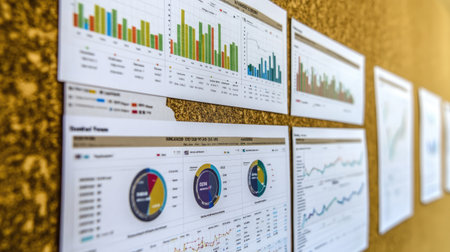
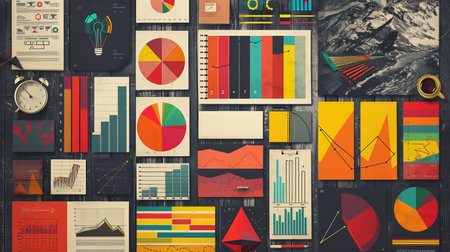
This image showcases a bulletin board displaying various business performance metrics through colorful charts and graphs, ideal for professional analysis and team discussions.
Коллекция по умолчанию
Коллекция по умолчанию
Создать новую
Business Objects in the office on the table.
Коллекция по умолчанию
Коллекция по умолчанию
Создать новую
Financial data analyzing on monitor. Abstract financial data analysis on monitor.
Коллекция по умолчанию
Коллекция по умолчанию
Создать новую
People take view business growth graphs
Коллекция по умолчанию
Коллекция по умолчанию
Создать новую

Analysis of data from graphs. select focus.
Коллекция по умолчанию
Коллекция по умолчанию
Создать новую
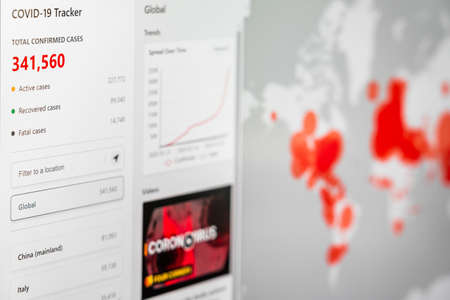
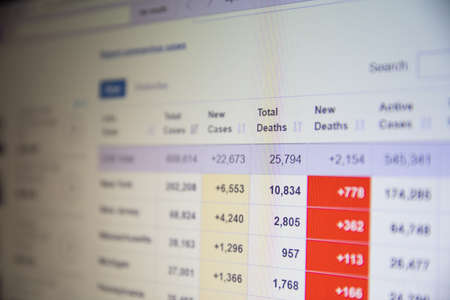
BUCHAREST, ROMANIA - MARCH 23, 2020: Coronavirus Total Cases Of The Pandemic Spreading All Around The Globe In March
Коллекция по умолчанию
Коллекция по умолчанию
Создать новую
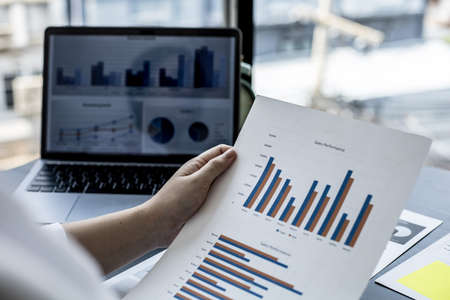
Working, analyzing graphics with the tablet and doing calculations
Коллекция по умолчанию
Коллекция по умолчанию
Создать новую
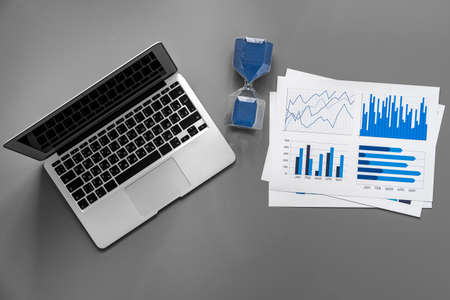
Laptop with graphs and charts. Business plan, financial analytics, statistics. Top view
Коллекция по умолчанию
Коллекция по умолчанию
Создать новую
Working, analyzing graphics with the tablet
Коллекция по умолчанию
Коллекция по умолчанию
Создать новую
Learn online, Student watching lesson online and studying from home. Young man taking notes while looking at computer screen following professor on video call. Studying from home on pc.
Коллекция по умолчанию
Коллекция по умолчанию
Создать новую
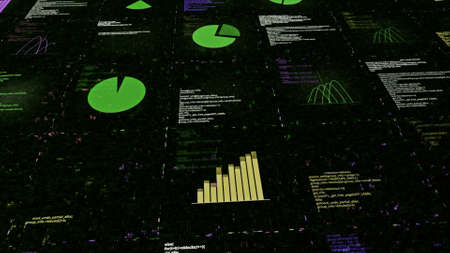
Schedules and programs. Amimation. A black background on which programs are written in bright colors and graphics are created in abstraction.
Коллекция по умолчанию
Коллекция по умолчанию
Создать новую
securities price chart on the monitor screen
Коллекция по умолчанию
Коллекция по умолчанию
Создать новую

Shallow depth of field (selective focus) with details of a candlestick chart on a computer screen.
Коллекция по умолчанию
Коллекция по умолчанию
Создать новую
Office workplace table with report pages with financial data
Коллекция по умолчанию
Коллекция по умолчанию
Создать новую
Financial paper with charts and diagrams on gray table
Коллекция по умолчанию
Коллекция по умолчанию
Создать новую
Documents with colourful charts, graphs and diagrams
Коллекция по умолчанию
Коллекция по умолчанию
Создать новую
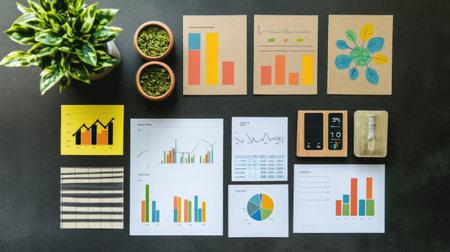
A visually engaging workspace featuring colorful charts and graphs alongside planters, ideal for presentations, data analysis, and professional brainstorming sessions.
Коллекция по умолчанию
Коллекция по умолчанию
Создать новую

reports and histograms on paper on the table, analytics and statistics on paper, business analytics
Коллекция по умолчанию
Коллекция по умолчанию
Создать новую

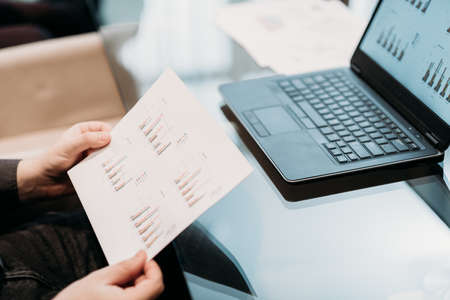
Business finance person is reviewing a company's financial documents prepared by the Finance Department for a meeting with business partners. Concept of validating the accuracy of financial numbers.
Коллекция по умолчанию
Коллекция по умолчанию
Создать новую
Smartphone and Tablet pc with financial charts and graphs on office desk, business concept
Коллекция по умолчанию
Коллекция по умолчанию
Создать новую

A statistical report with a diagram lies on the table
Коллекция по умолчанию
Коллекция по умолчанию
Создать новую
Strategic business planning for 2025 with graphs and financial data, highlighting new year goals and growth.
Коллекция по умолчанию
Коллекция по умолчанию
Создать новую
Business documents at workplace, financial report, close up
Коллекция по умолчанию
Коллекция по умолчанию
Создать новую
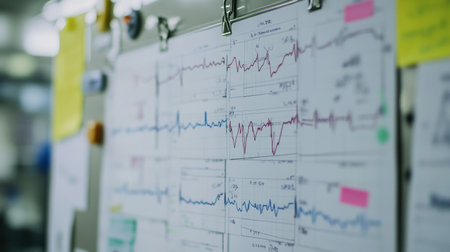
A collection of medical graphs and charts displayed on a clinic wall depicting various data readings. This image captures the essence of data-driven healthcare analysis.
Коллекция по умолчанию
Коллекция по умолчанию
Создать новую
Shallow depth of field (selective focus) with details of a candlestick chart on a computer screen.
Коллекция по умолчанию
Коллекция по умолчанию
Создать новую
financial chart on monitor as concept of stock market data analysis and investment
Коллекция по умолчанию
Коллекция по умолчанию
Создать новую
Abstract graphic consisting of blurred points , graph and chart . information concept.
Коллекция по умолчанию
Коллекция по умолчанию
Создать новую
Change the stock market chart. The fall in the value of cryptocurrencies. Brokerage data
Коллекция по умолчанию
Коллекция по умолчанию
Создать новую
Abstract glowing forex chart interface wallpaper. Investment, trade, stock
Коллекция по умолчанию
Коллекция по умолчанию
Создать новую
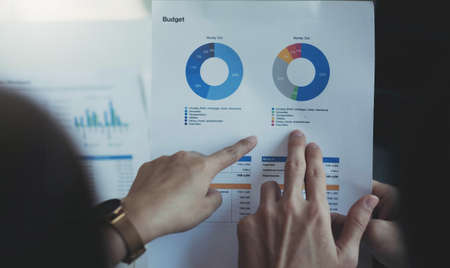
Colorful pie chart on a financial report with data visualizations displayed in a business setting in the afternoon
Коллекция по умолчанию
Коллекция по умолчанию
Создать новую

Business chart with line graph, bar chart and numbers on dark background, 3d rendering. Computer digital drawing.
Коллекция по умолчанию
Коллекция по умолчанию
Создать новую

Stock market graph on screen. Ticker on monitor screen. Investing, Finance and Economic concept. Shallow depth of field.
Коллекция по умолчанию
Коллекция по умолчанию
Создать новую
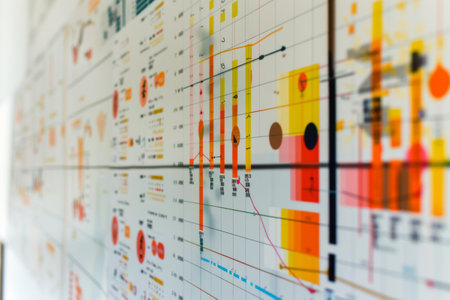
Marketing Analysis Charts, Graphs, and Data Visualization on a Wall, Business Concept
Коллекция по умолчанию
Коллекция по умолчанию
Создать новую
A vibrant array of business charts and graphs showcasing various data insights and trends, ideal for presentations and reports in a professional setting.
Коллекция по умолчанию
Коллекция по умолчанию
Создать новую
Printed graphs and laptop on dark gray surface
Коллекция по умолчанию
Коллекция по умолчанию
Создать новую
Financial graphic chart
Коллекция по умолчанию
Коллекция по умолчанию
Создать новую

Office desk table with laptop, supplies and financial reports. Top view with copy space
Коллекция по умолчанию
Коллекция по умолчанию
Создать новую
Detailed view of a graph displayed on a digital screen, showing trend analysis for website traffic flow, Incorporate trend analysis for website traffic fluctuations
Коллекция по умолчанию
Коллекция по умолчанию
Создать новую
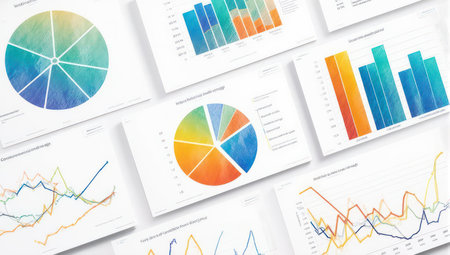
A variety of financial charts and graphs, including pie charts and bar graphs, are presented on a clean white background, illustrating data analysis.
Коллекция по умолчанию
Коллекция по умолчанию
Создать новую
Business graph analysis documents on gray background
Коллекция по умолчанию
Коллекция по умолчанию
Создать новую
A close up of financial report with graphs showcasing data analysis and investment trends
Коллекция по умолчанию
Коллекция по умолчанию
Создать новую
Development and growth concept. Businessman plan growth and increase of positive indicators in his business.
Коллекция по умолчанию
Коллекция по умолчанию
Создать новую
Close up shot on digital screen Candlestick Chart of stock market change and volatility prices profit or loss
Коллекция по умолчанию
Коллекция по умолчанию
Создать новую
New york, USA - November 24, 2020: Google ads marketing website summarydashboard on laptop screen
Коллекция по умолчанию
Коллекция по умолчанию
Создать новую

Financial paper with charts and diagrams on gray table
Коллекция по умолчанию
Коллекция по умолчанию
Создать новую
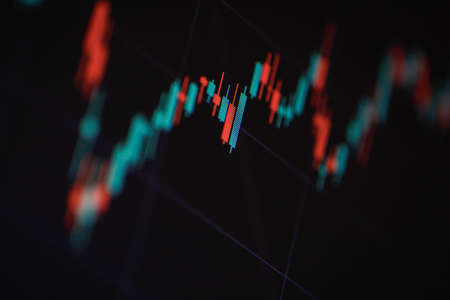
Stock market or forex trading graph and candlestick chart suitable for financial investment concept. Abstract finance background.
Коллекция по умолчанию
Коллекция по умолчанию
Создать новую
A close-up of a line graph showing fluctuating trends, used to analyze market behavior or performance over time.
Коллекция по умолчанию
Коллекция по умолчанию
Создать новую

The word Data, alphabet on wooden cubes on paper graph background. Research study or information analysis, facts and knowledge for education or business.
Коллекция по умолчанию
Коллекция по умолчанию
Создать новую
A business finance woman is reviewing a company's financial documents prepared by the Finance Department for a meeting with business partners. Concept of validating the accuracy of financial numbers.
Коллекция по умолчанию
Коллекция по умолчанию
Создать новую
Stock Market Loss Trading Chart Investment Analysis Business Index Chart Finance Board Chart
Коллекция по умолчанию
Коллекция по умолчанию
Создать новую
Abstract financial graph with candle stick and bar chart of stock market on financial background
Коллекция по умолчанию
Коллекция по умолчанию
Создать новую

Business finance chart document report. Generative AI
Коллекция по умолчанию
Коллекция по умолчанию
Создать новую
A woman uses a laptop and presses a white calculator, she is a company auditor, she checks documents from the laptop and calculates the numbers for accuracy. Financial audit concept
Коллекция по умолчанию
Коллекция по умолчанию
Создать новую
Work table of a businessman with papers, graphs and glasses. Business presentation template with papers, folder and a chair in the background. High quality photo
Коллекция по умолчанию
Коллекция по умолчанию
Создать новую
A close-up view depicts a detailed chart displaying financial data analysis, with various lines and bars in contrasting colors. The image showcases a digital display with numerical values and graphical representations, suggesting market fluctuations and trading activities. It is suitable for illustrating concepts related to business, finance, and investment.
Коллекция по умолчанию
Коллекция по умолчанию
Создать новую
NAMPA, IDAHO - APRIL 14, 2020: Number of deaths as per worldometers website
Коллекция по умолчанию
Коллекция по умолчанию
Создать новую
Highly rendering of paper charts and graphs on the wall. Business concept
Коллекция по умолчанию
Коллекция по умолчанию
Создать новую

A close-up of a futuristic holographic interface with glowing transparent screens displaying various financial charts and data.
Коллекция по умолчанию
Коллекция по умолчанию
Создать новую
Fund managers team consultation and discuss about analysis Investment stock market by digital tablet.
Коллекция по умолчанию
Коллекция по умолчанию
Создать новую
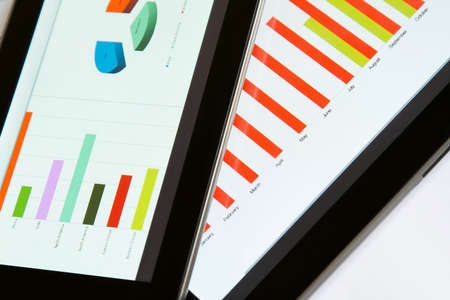
Stockmarket diagram and grah on displayscreen
Коллекция по умолчанию
Коллекция по умолчанию
Создать новую
Graph on the desk analysis and laptop with business
Коллекция по умолчанию
Коллекция по умолчанию
Создать новую
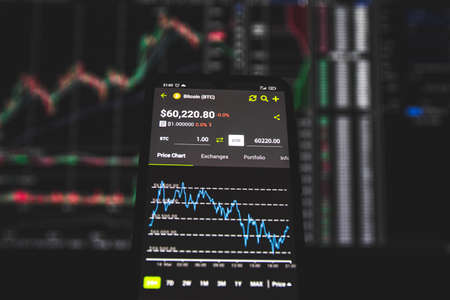
Cryptocurrency exchange chart. Bitcoin price goes up to 60 000 dollars. Blockchain and digital money
Коллекция по умолчанию
Коллекция по умолчанию
Создать новую

Close-up of a bar graph with rising columns indicating business success and profits.
Коллекция по умолчанию
Коллекция по умолчанию
Создать новую
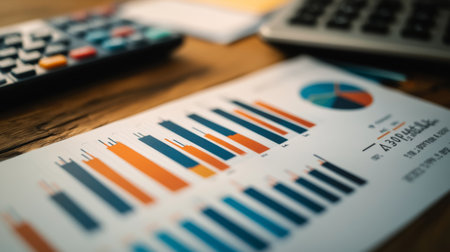
Close-up of a printed financial graph with colorful bar charts and line indicators, displayed on a desk alongside financial documents and a calculator.
Коллекция по умолчанию
Коллекция по умолчанию
Создать новую
business documents graphs. laptop hands holding papers. report statistics data analysis. office workplace
Коллекция по умолчанию
Коллекция по умолчанию
Создать новую
Close up of a business report, illustrating data analysis, financial information, and professional documentation.
Коллекция по умолчанию
Коллекция по умолчанию
Создать новую
Man showing business graph on wooden table
Коллекция по умолчанию
Коллекция по умолчанию
Создать новую

Business success and growth concept.Stock market business graph chart on digital screen. Stock trading, crypto currency background.
Коллекция по умолчанию
Коллекция по умолчанию
Создать новую
relax, de-stress, holiday, happy, Asian woman relaxing at home listening to music from smartphone and laptop happily.
Коллекция по умолчанию
Коллекция по умолчанию
Создать новую
Economic graph with diagrams on the stock market, for business and financial concepts and reports.Abstract blue background.
Коллекция по умолчанию
Коллекция по умолчанию
Создать новую
Collage background visual of various business scenes. Management strategy.
Коллекция по умолчанию
Коллекция по умолчанию
Создать новую

A close-up of a digital dashboard with rising investments, offering space for adding content about investment performance, growth, or risk management
Коллекция по умолчанию
Коллекция по умолчанию
Создать новую
The business plan at the meeting and analyze financial numbers to view the performance of the company.
Коллекция по умолчанию
Коллекция по умолчанию
Создать новую

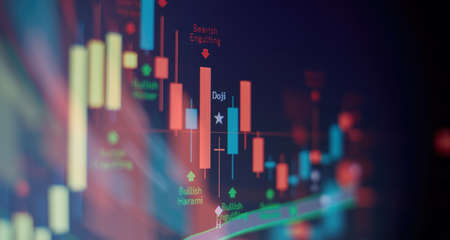
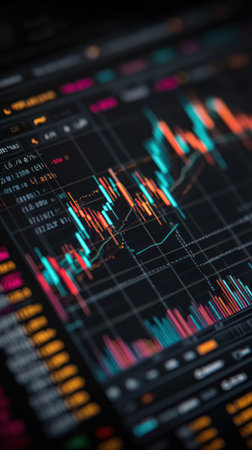
Stockmarket online trading chart candlestick on crypto currency platform. Stock exchange financial market price candles graph data pattern analysis concept. Computer screen closeup background
Коллекция по умолчанию
Коллекция по умолчанию
Создать новую
A trader investor analyzes candlestick charts of stocks, crypto currencies in a smartphone application. Trading, investing and technical analysis concept. Close-up of a smartphone screen. 4k
Коллекция по умолчанию
Коллекция по умолчанию
Создать новую
A close-up of a vertical bar chart with varying heights of bars, highlighting trends and comparisons between different data sets with a clean, white background
Коллекция по умолчанию
Коллекция по умолчанию
Создать новую
This image showcases an abstract view of financial data with colorful graphs and lines on a black background, highlighting various trends in stock market performance analysis.
Коллекция по умолчанию
Коллекция по умолчанию
Создать новую
Legion-Media
Создайте свои проекты на основе качественных стоковых фотографий и видео.


Copyright © Legion-Media.